
The demo always works
I have never seen an AI agent fail during a demo. Seriously, not once.
You open a notebook, run the cells, the agent calls a tool, gets a response, reasons about it, calls another tool, and produces a beautiful final answer. The room nods. Somebody says "that's amazing." Somebody else asks if this is ready for production.
You say yes because at that moment you genuinely believe it.
Then a week later you see the first weird production result and feel that small drop in your stomach. Not because the model was wrong once. Because you suddenly realize you cannot explain why it was wrong.
I believed it too. I've seen the same pattern with support-style agents: classify the ticket, pull customer history from a database, decide whether to escalate or auto-respond, then draft the reply. In the demo, that flow looks flawless. In production, it starts doing things you cannot explain. Responses that used to take 2 seconds now take 8. Costs creep up without any visible change in traffic. A handful of users get replies that feel obviously wrong but the agent marks them as confident anyway.
The worst part was not the failures themselves. It was the helplessness. We had no way to see where in the chain things went sideways.
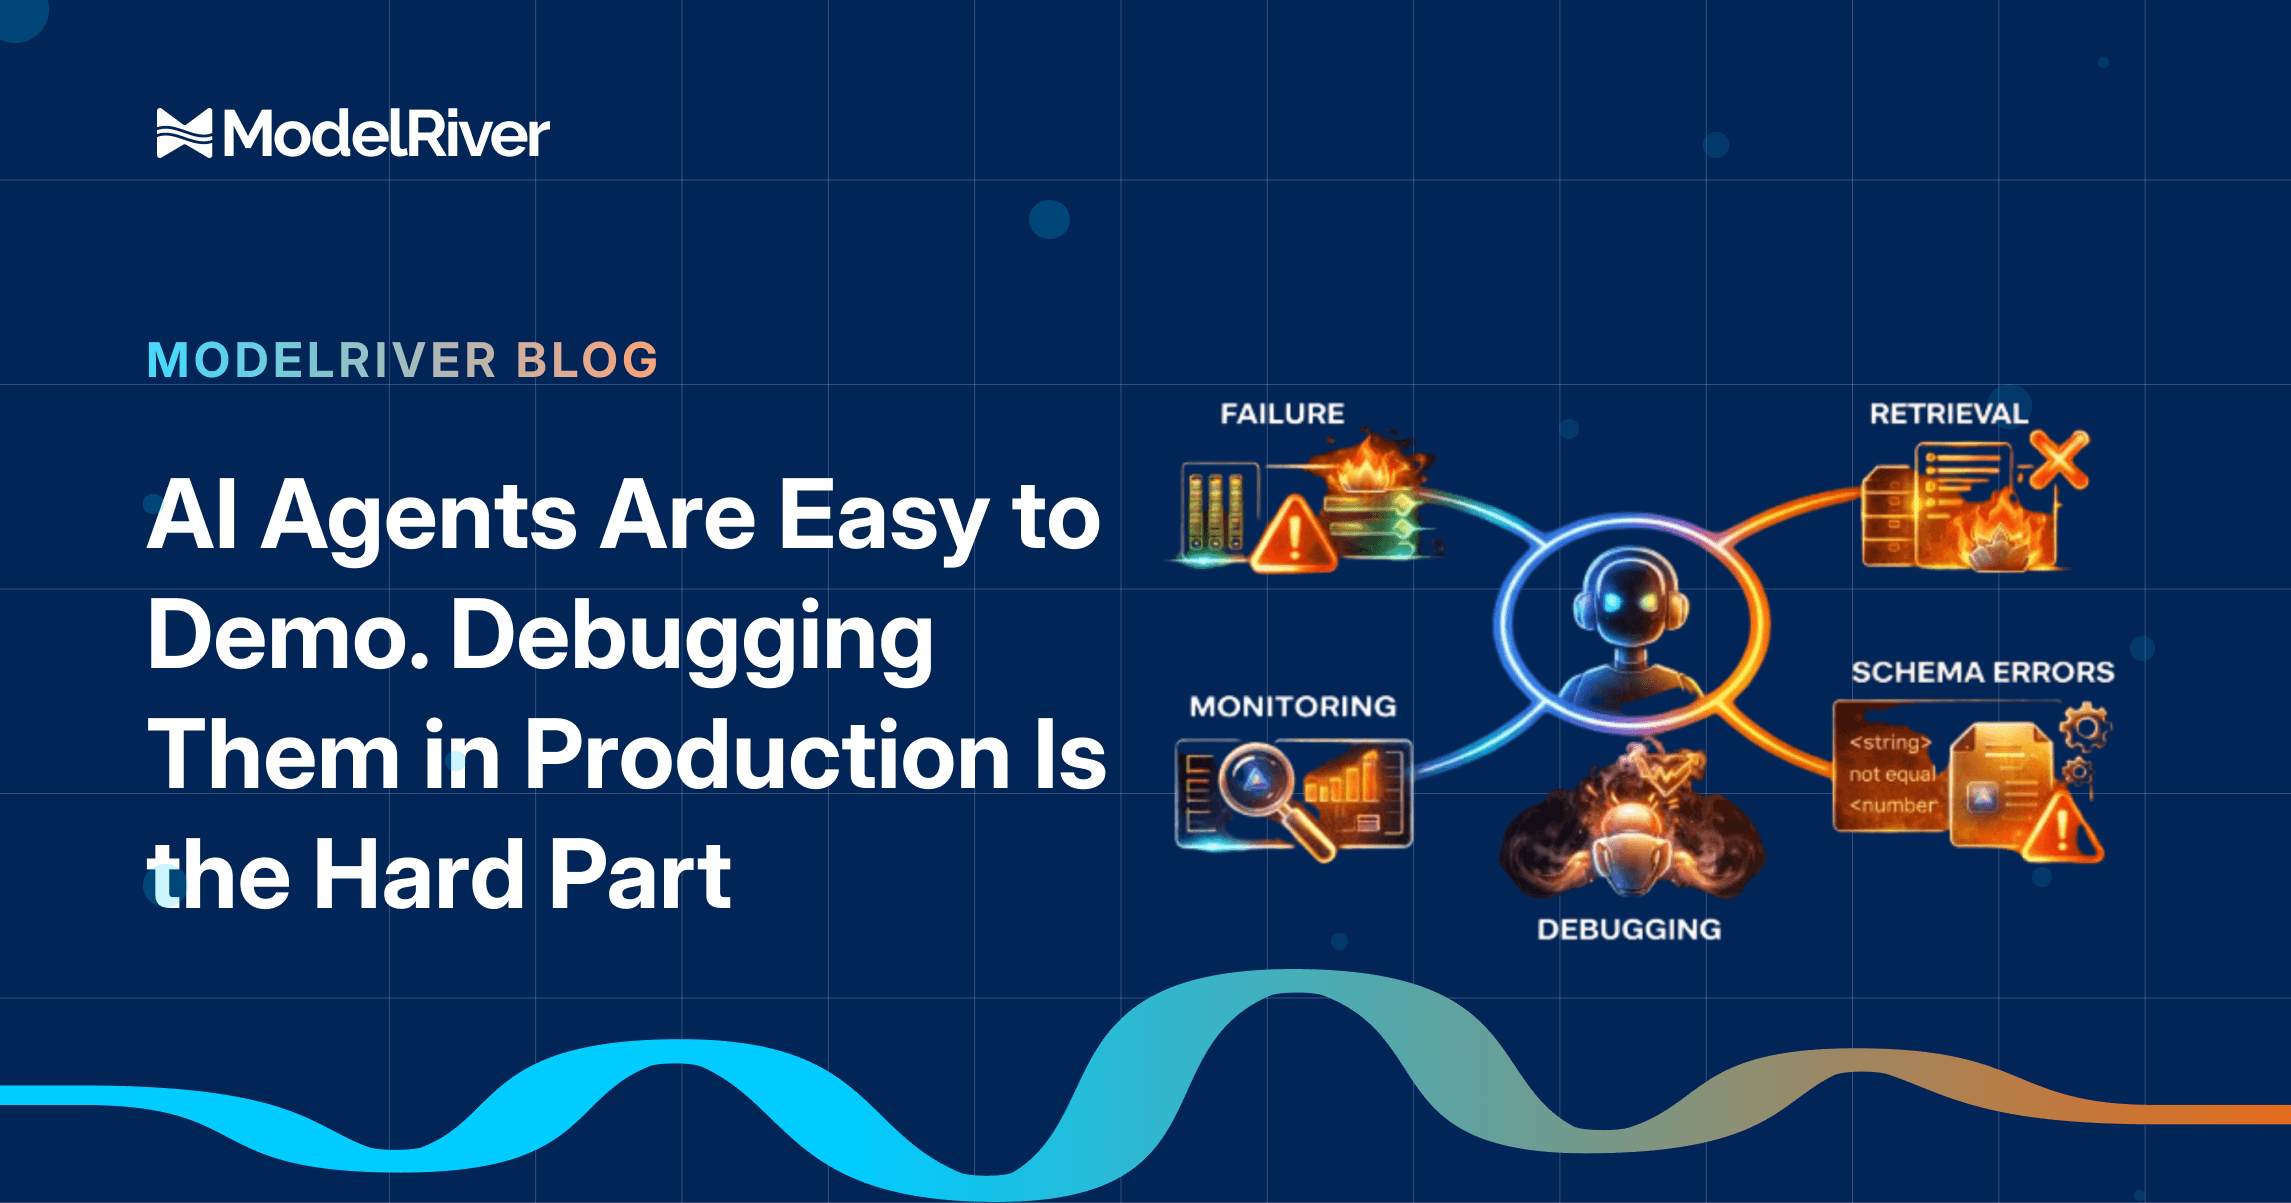
Why agents are harder to debug than regular AI features
A single LLM call is straightforward to debug. You send a prompt, you get a response, you see what happened. If it's wrong, you fix the prompt or change the model.
An agent is not a single call. It's a chain. Sometimes a graph. Sometimes a loop.
When something breaks in this chain, the symptoms show up at the end but the cause lives somewhere in the middle. The agent picked the wrong tool in step two. Or the tool returned an unexpected format in step three. Or the second LLM call hallucinated because the context from step four was too noisy. Or maybe nothing "broke" at all — the agent just took a slightly different path than usual and the result is subtly worse than it should be.
Traditional debugging tools are not built for this. Your application logs show the final response. Your provider dashboard shows token counts. Neither one shows you the decision chain that led to the output.
The debugging tools AI devs actually use
If you're building agents today, you've probably cobbled together some version of this stack:
-
Print statements and logging. You scatter
print()orlogger.debug()calls across your agent code. It works until your agent has 6 steps and your terminal is 200 lines of unstructured output. Then you're debugging your debug logs. -
LangSmith traces. If you're using LangChain or LangGraph, the traces are genuinely useful. You can see each node, each LLM call, each tool invocation. The limitation is that it's tightly coupled to the LangChain ecosystem. If your agent uses raw SDK calls, or mixes frameworks, or does anything outside the LangChain abstraction, those steps disappear from the trace.
-
Provider dashboards. OpenAI's usage page tells you how many tokens you burned. It does not tell you which agent step burned them, or why step three took four times longer than usual, or whether your backup model was used because the primary rate-limited.
-
Weights & Biases / Weave. Good for experiment tracking and prompt versioning. Less useful for real-time production debugging where you need to understand why a specific request at 3am took a weird path.
Each of these helps with a piece of the puzzle. None of them give you the one thing that matters when an agent goes wrong in production: a clear way to inspect the LLM requests your agent actually made, see which provider attempts happened, and spot the moment a request went sideways. If you also want tool-level traces inside your app runtime, you still need application or framework-level instrumentation for that.
The 2% that breaks
Here's what I've learned from watching agents fail in production. The failures fall into five patterns, and almost none of them show up during development.
Provider instability
Your agent makes three LLM calls per request. If each call has a 99% success rate, your agent has a 97% success rate. That 3% failure rate sounds small until your Slack lights up because thirty users out of a thousand hit a broken experience today. And when the failure happens in step two of a four-step chain, the agent doesn't crash cleanly — it often continues with garbage context and produces a plausible-sounding but wrong response.
The fix seems obvious: add retry logic. But retrying step two of an agent chain is not the same as retrying a stateless API call. The context has already been built, the conversation state exists, and you need to decide whether to retry just the failed call or rerun the whole chain. Most teams get this wrong at least once.
Latency compounding
A single LLM call takes 1-3 seconds. An agent with four LLM calls takes 4-12 seconds. Add a tool call that hits an external API and you're at 15 seconds. Add a retry because the first attempt timed out and you're at 20 seconds. Your user is staring at a spinner. Your frontend times out. Your customer support inbox fills up.
The insidious thing about latency compounding is that it doesn't show up in your average latency metrics. Your p50 looks fine. Your p99 is a nightmare. And the p99 users are often the ones with the most complex queries — the power users you can least afford to lose.
Tool selection drift
Your agent has access to five tools. In testing, it reliably picks the right one. In production, with messier inputs and broader query diversity, the agent starts picking tools that technically match but produce worse results. A search tool when it should have used a database lookup. A general-purpose summarizer when it should have used a domain-specific extractor.
You don't notice this right away because the agent still "works." It still produces an answer. The answer is just slightly less good, and the signal is buried in noise. By the time you realize the accuracy has drifted, you've been serving degraded results for weeks.
Token explosion
An agent loop that should finish in two rounds — classify, then summarize — occasionally decides it needs four or five passes because the classification output was ambiguous. Each iteration adds to the context window. By iteration four, the context is so large that the LLM call is expensive and slow, and the model starts losing track of the original intent because the relevant information is buried in pages of intermediate reasoning.
I've seen a single runaway agent request burn through $2 in tokens. That's not a lot of money, but when it happens 50 times a day because a certain class of user input triggers the loop, it becomes a real budget problem.
Output drift
This is the subtlest failure mode. Your agent produces outputs that are technically correct but gradually shift in tone, format, or specificity as production traffic patterns change. The prompts haven't changed. The model hasn't changed. But the distribution of inputs has changed, and the agent's behavior drifts in ways that are hard to detect without looking at the actual request and response bodies over time.
What you actually need
After fighting these problems across multiple projects, I've come to believe that the core debugging problem with agents boils down to two things: per-request lifecycle visibility, and a clean way to correlate related requests that belong to the same agent run.
Not just logs. Not just dashboards. A timeline for each request, plus identifiers that let you connect the requests together.
For every ModelRiver request, you need to see:
- Which provider and model handled the request
- How long each provider attempt took
- Whether any failover was triggered
- The exact request and response bodies for the request and failed attempts, when body logging is enabled
- Token usage and estimated cost
- Where that specific request broke, or where it took an unexpected path
If your agent makes multiple LLM calls, you should also be able to correlate those requests by workflow name, customer_data, or some other stable identifier for the run. Not grep through logs. Not cross-reference three different dashboards. One place to inspect each request, and one way to connect them.
An example: the 8-second agent
Let me make this concrete with a representative setup.
Say you have an agent that processes customer feedback. The normal flow takes about 2 seconds end to end: classify the feedback, extract key themes, generate a summary. Three LLM calls in app code, each routed through ModelRiver as its own workflow so you can inspect them separately.
One morning, users start complaining about slow responses. Average latency has jumped from 2 seconds to 8 seconds. Nothing has changed in your code. Traffic is normal. That is the kind of bug that makes you doubt your own memory.
Without per-request visibility, here's what debugging looked like:
- Check application logs. No errors. All requests returning 200.
- Check provider dashboard. Token usage is up, but that could be anything.
- Add more logging. Redeploy. Wait for it to happen again.
- It happens again. The new logs show that the second LLM call is taking 5 seconds instead of 0.5 seconds.
- Why? Is it the provider? Is it our prompt? Is the context too large?
- More logging. Redeploy. Wait.
That loop can easily eat two days.
With request timelines plus a shared run identifier in customer_data, here's what debugging looked like:
- Open Request Logs and filter by the affected run or user ID.
- See that the
classifyworkflow request took 400ms (normal). - Open the
extractworkflow request and inspect its timeline: the primary provider degraded after 3 seconds, then the fallback model took 4.5 seconds. - See that the
summarizeworkflow request took 800ms (normal). - Root cause in 5 minutes: the primary provider had started degrading requests at the model level before surfacing a clean API error. What reaches your app looks like an incomplete response rather than an obvious
429, so failover only kicks in after the request has already gone slow. And when it does kick in, it sends traffic to a slower backup model.
Total debugging time: 5 minutes instead of 2 days. And you catch something you probably would not have found with logs alone — an incomplete-response pattern that silently degrades output quality on requests that do not quite hit the failover threshold.
Those correlated request logs told the whole debugging story. No log archaeology. No guessing. Mostly just relief.
What this means for how you build
The mental model shift is simple, and it's the same shift we went through with databases and APIs a decade ago.
Stop treating AI calls as special. Treat them as infrastructure.
When your application calls a database, you expect to be able to trace that query, see its execution time, understand which index was used, and diagnose slow queries with a query plan. Nobody would accept a database that said "your query was slow but I can't tell you why."
When your application calls an external API — Stripe, Twilio, any third-party service — you expect a request log that shows the exact payload, response, timing, and status code for every call. That's baseline infrastructure observability.
AI calls deserve the same treatment. Especially agent calls, where the chain of decisions is messy enough that you cannot reliably reason backward from the final answer.
If you're still choosing the framework layer itself, Top LLM Frameworks in 2026 (Compared + Use Cases) is the better comparison for that decision.
This isn't specific to any one framework — whether you're using LangGraph, CrewAI, or the Agents SDK, the gap is the same. The framework gives you the tools to build the agent. It doesn't give you the tools to debug the agent in production at 3am when something you can't explain is happening.
A practical starting point
If you want to start building this kind of visibility into your agent workflows, here are three steps that work regardless of what framework you're using.
Step 1: Route your agent's LLM calls through a layer you control. Instead of calling providers directly, call an intermediary that logs every request and response. This is the single biggest lever. Once you have the raw data, everything else follows.
If you're using the OpenAI SDK, LangChain, LlamaIndex, or any OpenAI-compatible client, ModelRiver gives you this out of the box — point your base_url to https://api.modelriver.com/v1 and each call routed through ModelRiver gets logged with timing, token usage, and failover chains. Request and response bodies are logged by default at the project level and can be disabled if you do not want to store them. You can also build this yourself with a proxy, but the logging, timeline visualization, and failover handling add up fast.
Step 2: Name your agent steps. Use separate workflows for stable steps in your agent chain — "classify," "extract," "summarize" — or at minimum tag calls with consistent customer_data so related requests can be filtered together. When something goes wrong, you can immediately see which step caused the problem instead of looking at a wall of unattributed LLM calls.
Step 3: Review request timelines, not just metrics. Averages hide problems. The p99 is where your agents are currently suffering. Pick one slow or failing request, open the timeline, and then check the neighboring requests from the same agent run. Do this once a week and you'll catch drift patterns weeks before they show up in aggregate metrics.
When you do not need this
Not every AI application needs per-request lifecycle visibility. If you're building:
- A single-call AI feature — one prompt in, one response out, no chain — then standard logging and your provider's dashboard are probably enough.
- A prototype or weekend project — keep it simple, add observability when traffic justifies it.
- An offline batch pipeline — where latency doesn't matter and you can inspect outputs at your leisure.
- Research or experimentation — where you're optimizing prompts in a notebook, not debugging production incidents.
This pattern matters when you have real users, multi-step agents, and you need to understand what happens when things go wrong at 3am without waking up your whole team.
The shift is already happening
The AI industry spent 2024 and 2025 building increasingly complex agents — more steps, more tools, more autonomy. That's not slowing down. But the debugging infrastructure has not kept pace with the complexity.
We're at the same inflection point that backend development hit when microservices became mainstream. The same tools that worked for monoliths — printf, grep, and prayer — didn't work for distributed systems. The industry built distributed tracing, structured logging, and observability platforms. Not because the old tools were bad, but because the architecture demanded a different kind of visibility.
AI agents are following the same arc. The architecture has gotten complex enough that the debugging tools need to catch up. The teams that build this visibility into their stack early will spend less time firefighting and more time building.
If you want to try this pattern, ModelRiver's getting started guide takes only a few minutes to set up, and your first request log will show you more about your agent's behavior than a week of print-statement debugging.